All books purchased from our website are in PDF form and is non-refundable.
Quintessences of Trading Series finally complete and available in PDF form.



SINGLE PRINTS (Quintessences of Trading Part 1)
Available as PDF1 Introduction
If I were asked to choose a single tool from the broad spectrum of auction theory and order flow, my choice would be single prints. Why? As the name suggests, single prints consist of single-row time blocks within a TPO market profile and are the catalysts for significant price movements. When viewed in context, they signal directional activity by large market participants. Only these participants can move the market.
Unlike volume-based profiles, the time factor plays a decisive role here. Aggressive and rapid price movements are the most obvious indication of actions by dominant market forces. Single Print zones can help answer the most important question for a day trader.
- Who is in control of market activity?
- Is the market making sufficient efforts to pursue a specific direction?
Readers of this book should have a basic understanding of auction theory and chart structures, because, as with everything in trading, there are no solutions that, when used in isolation, lead to sustainable success. The more a trader understands the complex interplay of various factors, the greater the chances of not being wiped out by the market—especially in the early stages of their journey—like most retail traders. However, this is only possible through intensive observation of market activity and the resulting accumulation of experience.
TPO profiles and single prints in their basic form do not require order flow. They reduce market activity to its essentials. This leads to a more relaxed approach to price behavior. Throughout the book, another variant of single prints is also introduced, which is based on the ideas of its namesake, incorporates order flow, and is applied to charts from the year 2026.
The first part deals with the fundamentals and manifestations of Single Print zones. The original description, as conceived by the founder of the TPO Market Profile in the 1980s, involves a clearly visible deviation from a symmetrical, bell-shaped profile. The practices of floor traders on La Salle Street in Chicago at that time were primarily based on daily charts, but 30-minute profiles of pit trading (RTH) were also created. The Initial Balance, a summary of the first two 30-minute periods, was considered at the time to be indicative of the direction for the rest of the day.
However, the creator of this approach, Peter Steidlmayr, pointed out as early as the late 1980s that, with one exception, he had ceased to pay attention to the Initial Balance from the mid-1980s onward, as the structure of market participants was already beginning to shift significantly in favor of institutional investors. Traders who still follow this approach as standard today seem to be ignoring the signs of the times. The latter part of the book highlights ways to evaluate the first trading period in a more contemporary and flexible manner.
Another section of the book deals with filtering processes for single prints. Determining the significance of identified zones is another central theme. Contrary to the later view that single-print zones are “neutralized” once they have been crossed, the reader learns that these zones can remain active. Meaningful combinations of individual elements within this subject area, as well as practical advice, run throughout the entire book.
All illustrations on charts were written in English to save time, as this book is also published in other languages. The time axes of the charts are based on the Central European Time zone, because the greatest interest in my books comes from there. Whereas US trading hours used to offer more opportunities, today these opportunities are available around the clock for some instruments.
To conclude this introduction, I would like to note that, as is generally the case with Profile Zone and Order Flow theory, there may be different interpretations regarding the topic of single prints. This book merely reflects my perspective and is based on 10 years of intensive observation.
Single Prints are the building blocks of price action in all markets. This book features 50 charts from the year 2026 on this largely unknown topic. It is part of a series of four treatises covering different segments, knowledge of which can be of great benefit to retail traders. Trading books can be long-winded, containing a lot of theory and relatively few charts. This one is short but contains many. Furthermore, considering that the founder of Single Print Zones devoted only two pages to this topic, this treatise seems like an avalanche.
Thanks to my colleague Evangeline Yrat for her help in bringing this project to fruition.
FAKE MOVES (Quintessences of Trading Part 2)
Available as PDF1 Introduction
Over the past few years, there has been a growing interest in auction theory and order flow. I got the impression that some traders, in their eagerness to achieve quick results, were skipping over fundamental knowledge of chart structures during this learning process. An email summed this up perfectly. It read: “I’ve taken a course on order flow, but something is missing.”
Indeed, at first glance, it seems simple to draw profiles and mechanically trade the lines derived from them. This leads to viewing reference zones without context. Sustainable success is only possible through a more in-depth analysis that takes into account how promising trading opportunities arise. Order flow can also present many puzzles, as it is often riddled with confusing algorithms.
Significant price movements always cast a shadow ahead that must be deciphered. This is especially true in intraday trading, where most retail traders are active. Large market participants generally operate across all time frames. To steer the market in their desired direction, they need the vast majority of retail traders to create “space” for their operations. This does not fit the image of traders who predominantly follow classical technical trading approaches.
Processes of this kind are also referred to as “displacement tactics” in the investment encyclopedia Investopedia. This term refers to false signals from well-known chart patterns and false breakouts. Accordingly, knowledge of these patterns can be profitable for traders using shorter time frames if the false signals that occur are linked to auction theory and confirmed in this way. Readers of this book should therefore have some prior knowledge of this subject area.
The book is not entirely opposed to technical analysis in general. Some basic principles still apply: support and resistance, retracement and reflex rallies, or the assumption that prices move in trends over the long term. But these zones have become more blurred since the pioneering days of this form of analysis, or in many cases suddenly reverse to the opposite. Furthermore, the fact that this is a kind of pseudoscience without empirically proven foundations cannot be easily dismissed. Prices do not dance to the tune of familiar chart patterns or indicators, but increasingly head toward liquidity, aggression, and key zones.
With more than 60 charts from the year 2026, this book provides insight into the most important deceptive maneuvers that occur on a daily basis. These can also manifest in complex forms, and it is not always easy to recognize them. The reader is provided with a step-by-step plan that is best suited for identifying fake moves.
A cornerstone of successful trading should always be the effort to put oneself in the mindset of the mass of retail traders, as it is well known that there is an extremely high loss rate among them. Millions of traders from all over the world learn no more than a handful of patterns and “magic formulas” and embark on a short-lived trading career without realizing that trading is a highly demanding activity. This has led to the 90/90/90 rule becoming firmly established in this industry. It states:
90% of all retail traders lose 90% of their trading account within 90 days.
Since this book is also being published in other languages, all illustrations on the charts have been labeled in English to save time. The Central European Time Zone was used as the basis. For some situations in this book, I felt compelled to find a few short, appropriate English-language expressions— —since there are no equivalents for these in either German- or English-language trading literature, and I wanted to avoid cumbersome descriptions.
Fake moves are key drivers of significant price movements, especially in intraday trading. For day traders, it is essential to find suitable entry points.
This second part of my four-part series “The Essentials of Trading” thus follows seamlessly from Volume 1 (Single Prints).
This treatise, too, can make a significant contribution to dispelling the law of the jungle that governs 21st-century markets: kill or be killed.
Thanks to my colleague Evangeline Yrat for her help in bringing this project to fruition.
July 2026
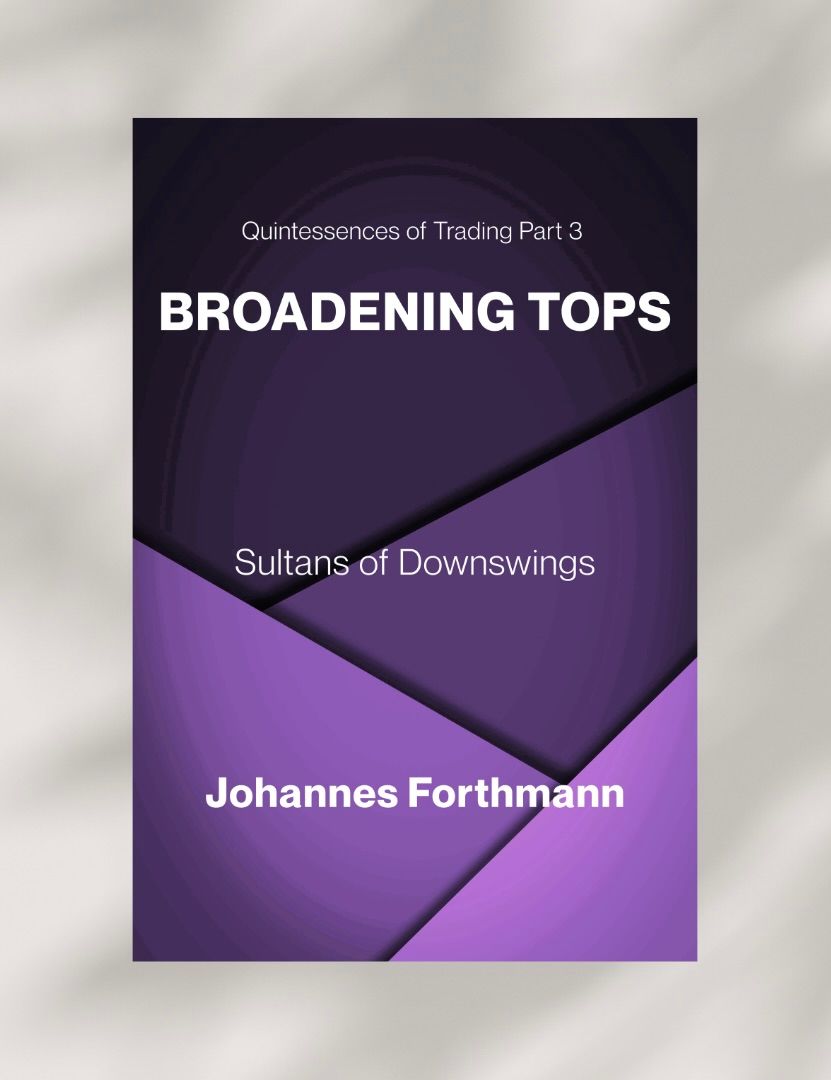
BROADENING TOPS (Quintessences of Trading Part 3)
Available as PDF1 Introduction
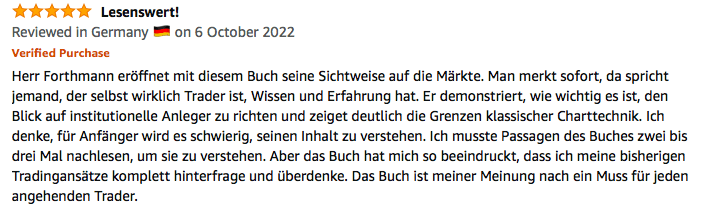
In the second part of my series “The Essentials of Trading,” I highlighted the most important displacement techniques associated with well-known chart patterns (Appendix). In this third installment, I will discuss a pattern that is based less on obsolete theories and more on verifiable facts.
Broadening tops are unique chart patterns that, unlike other well-known formations, are not used in an inverted form during a market bottom to make predictions that are not far removed from gazing into a crystal ball. They occur only at the end of bullish market phases and are based less on the geometric constructs—such as lines, triangles, and projections—that classical technical analysis uses to calculate the unpredictable.
Broadening tops reflect a market phase in which traders from other time frames (OTFs) have already exited the market and/or are sitting on the sidelines. Price action is now dominated solely by retail traders. As a result, one sees seemingly chaotic up and down movements that expand into oscillations. In today’s markets, broadening tops can be observed in every time frame. If a day trader recognizes the end of such a phase and combines this insight with elements of auction theory and additional filters, the probability increases that they are at the beginning of a significant move.
This book guides the reader through a topic on which there are only a few historical treatises, which have, however, been compiled here. In the second part, more than 60 charts from the first half of 2026 provide day traders with detailed insight into the manifestations and variations of this pattern. Considering that broadening tops shed light on only one direction of movement, this treatise serves as a highly effective supplement to other volumes in this series, thereby helping traders to be prepared for any situation.
To recognize these patterns and apply them successfully with additional filters, readers should have prior knowledge of chart structures and auction theory. With this in mind, this book is not suitable for beginners. The charts for the most common trading instruments are based on the Central European time zone, as most readers of my books are from that region.
Thanks to my colleague Evangeline Yrat, who supported this project.
July 2026
GOLD (Quintessences of Trading Part 4)
Available as PDF1 Overview
Countless books have been written about the long history of gold and the myths and theories that have arisen from it. This book does not explore that topic, but instead focuses specifically on the question of when one should buy or sell gold. Accordingly, it is suitable for market observers who, depending on their investment horizon, are keeping an eye on both short- and long-term trends in the price of gold in both market directions and wish to base their decisions less on vague theories.
The approaches to assessing the price of gold described in this book are based on a set of less abstract factors. Here, I describe aspects that I have observed over the past two decades in the run-up to every significant movement in the price of gold and have refined into filters. However, this is not a mechanical trading system based on mathematically oriented technical indicators or unrealistic approaches.
Rather, it draws on market-logic-based aspects that are integrated in a simple, graphical format. When these are combined with additional filters, the probability of subsequent significant price movements increases disproportionately and can provide traders with high-quality insights for sound trading decisions. Many elements of this book also apply to market participants who wish to assess the longer-term trend of the gold price over a broader time frame without having to rely on expert opinions.
The goal of the analytical methods described here is therefore not to gaze into a crystal ball, but simply to identify a higher probability of subsequent, significant price movements in the here and now or to avoid the frustrating experience of jumping on a train that left the station long ago.
The book begins with a critical examination of mainstream theories and an overview of price trends in recent years. In the following chapters, filters are introduced step by step that provide helpful information during the early stages of significant price shifts. The more of these factors that occur simultaneously, the greater the likelihood of a resulting price movement. With 78 charts covering the years 2023 through 2026, this book is an indispensable, no-nonsense guide for day traders, swing traders, and gold investors. The book concludes with a paper I wrote several years ago during my time as an analyst of gold mining stocks.
It should be noted that this book is less suitable for beginners. Knowledge of chart patterns, auction theory, and order flow is required. The latter topics can be found in my other books and are not repeated here.
The filters presented here are clearly structured and explained in a realistic manner. However, they also present some challenges, as they often disregard conventional technical approaches and fundamental perspectives. Charts may seem simple, but the reality is quite different. A book can only show developments in hindsight—developments that are not easy to recognize or assess in their early stages. There are many misconceptions surrounding trading in general. The most naive of these is the assumption that one can quickly achieve goals with as little work and effort as possible.
This treatise is Part 4 of my book series “Quintessences of Trading.” The illustrations on the charts were written in English to save time, as this book is also being published in other languages. The Central European Time Zone ( ) was used as the basis, since most readers of my books come from that region.
Thanks to my colleague Evangeline Yrat, who also made the publication of this book possible.
August 2026

Physical copy available on Amazon. Other languages also available. (Click learn more).
Classical technical analysis, as taught in hundreds of books, proves unprofitable for traders in most cases. Well-known chart patterns and indicators can only analyze the past and are used by large market participants to deceive amateur traders daily across all timeframes. This book clearly demonstrates why the myth of self-fulfilling prophecies has long been nothing more than an illusion. Instead, it presents highly effective technical tools that can help day traders see behind the scenes, assess current trading situations, and follow the movements of dominant market participants. This book was written for day traders in the futures markets who are looking for new approaches. However, it is less suitable for beginners and more for traders who have experienced a crash landing in the world of technical trading approaches. An initial version was published in 2020 and ranked among the top trading literature for months. This book is a significantly expanded edition with over 120 updated charts, presented in color and some in landscape format for better understanding. Its great value lies in its clear structure, providing further insight into the complex world of profile zone and order flow analysis. Successful day trading will be impossible without this knowledge in the future. Basic knowledge of trade sizes, leverage, futures exchanges, and other related terms can be learned for free on any reputable financial website within a few days and is not covered in this book. Micro-futures and CFDs allow you to trade the most liquid instruments with manageable risks in both directions. Nevertheless, it's important to consider a few realistic questions before venturing into this field. These are discussed in detail throughout the book. The author was personally trained 18 years ago by one of the most experienced US futures traders and worked for a renowned Swiss asset management firm. Day trading and hedging equity portfolios have been his specialty for 25 years. Trade the Reality

Most day traders primarily operate in the world of stock index futures and stocks. However, the demand for commodities will always exist and has accompanied humanity since its beginnings. All currently known theories for determining future market movements were developed by traders in the commodity futures markets, as these are more strongly oriented towards supply and demand. This book aims to identify significant intraday movements in selected commodity markets at an early stage. It is intended for advanced traders who aspire to become full-time professionals. Basic knowledge of TPO, volume profiles, and order flow was covered in my 2022 publication, "The Next Generation of Day Trading," and is not explored in greater depth here. These thought processes occur rapidly in day trading and are not suitable for everyone. However, they come closer to reality than any other attempt to predict future price movements in markets. A crucial aspect is that the timing of market entry or exit is decisive for success or failure, regardless of whether one is trading in the short, medium, or long term. In this sense, every market participant is a day trader. What makes this book unique is its diary-like structure, featuring well over 200 current charts from 2023, linking key zones with intra- or intermarket relationships. All the trading approaches presented here are largely unknown. The final section of the book also introduces filters for short-term gold trading, based on two decades of observation.

Working professionals in Europe typically only have the early European evening hours to monitor the market. Domestic markets are less suitable, as institutional trading ceases at this time. It is the US markets that offer opportunities for traders during the European evening hours. This book is not intended for beginners but builds upon my 2022 work, "Volume Profile, Market Profile, Order Flow - The Next Generation of Day Trading," which explained essential fundamentals. In this respect, this book also serves as a supplement for full-time day traders, as it addresses further important topics and analytical methods. Unlike scalping, the approaches presented here focus on trading situations where the probability of significant price movements is increased. Furthermore, it is made clear that there is no holy grail of setups that can be forced into a rigid set of rules. 49 graphical illustrations are designed to help advanced traders improve their market understanding and optimize their trading style. Profile zone and order flow analysis alone do not guarantee successful trading, as trading in general requires additional qualities that lie within oneself. These qualities must mature through a process based on observation, experience, and determination, ultimately giving a trader the necessary instinct for a profitable trading opportunity. The latter part of the book summarizes a few aspects that every trader should observe in themselves.

Physical copy available on Amazon. Other languages also available. (Click learn more).
This book was written after several years of research regarding the crypto market. It is suitable for traders looking for short-term trading opportunities in both market directions.
It may be the first book to describe some principles of auction theory, as well as filters for the crypto market. Against this background, this book is a pioneering work, as it shows ways to assess this market more accurately from a holistic perspective than with conventional technical trading approaches.
My book was first published in a rudimentary version at the end of 2022, updated in the summer of 2025, and revised based on the latest findings. Why? While previous years were characterized by periods of insufficient liquidity, this situation has improved significantly since the beginning of 2024 and offers optimal conditions for short-term trading.
Over 100 current charts covering the year 2025 with detailed illustrations make this book a systematically structured standard work for crypto traders looking for alternative analysis methods. The analytical steps shown here allow for an objective assessment of the future market direction, although they may seem a little unfamiliar at first.
The purpose of the trading approaches presented here is not to follow assumptions, forecasts, expert opinions, trend-following theories, indicators, or "gut feelings," but to enter the market as quickly as possible after major market participants have done so. Another highlight of this book are filters that are based on fundamental aspects but are clearly integrated into charts.
Despite my efforts to write in a simple and understandable way, this book is less suitable for beginners, as it also requires some basic knowledge of charting. It is more suitable for traders who have crashed and burned using conventional technical methods.
The human brain can set many traps. It tends to classify things the way you want to see them. It also wants to find simple solutions and stick to things that have proven themselves repeatedly in the past. Accordingly, my book is not recommended for traders who are looking for a compromise between old and new trading approaches. Such an approach carries the great danger of falling into a kind of analytical schizophrenia.
The much-cited price action theory only comes into play to a limited extent here, because it is not the eighth wonder of the world when a price candle makes a higher high and a higher low, and vice versa. How else would a market rise or fall? Price action theory is also subject to subjective interpretation. The thesis that prices move predictably with repeating chart patterns is controversial, because otherwise there would be a large number of trading millionaires. The opposite is the case. It is estimated that more than 90% of all technically oriented traders remain unsuccessful.
For some time now, traders have been talking about profile zone and order flow analysis. In my opinion, these belong together logically and in terms of content. I was all the more surprised that, to date, there are hardly any books that link these useful forms of analysis to small time frames at the intraday level, which are important for day traders.
In relation to the crypto market, one reason for this may be that there is currently very little software available that allows TPO, volume profiles, and order flow to be used effectively. This book was written using Gocharting software. This at least saved me from having to work with three different charting programs, as I had to in the past.
All in all, the approaches presented here are not secret miracle methods that work at the touch of a button, as countless promises on social media channels claim. Nevertheless, you will have positive experiences if you take a closer look at profile zones.
Since there are no exact conceptual equivalents in German and English-language trading literature for some of the trading situations and approaches in this book, I felt compelled to find a few short and appropriate English expressions to help avoid cumbersome paraphrases. Markets change, and definitions often lag behind. All illustrations on the charts presented here were written in English to save time. The time axes of the charts are based on Central European Summer Time.
Writing understandable books on a complex topic requires a lot of work and, above all, time. This book is the last in a series covering all areas of trading. Sustainable success in trading consists of a "lifetime learning" process that cannot be mastered with a few "set-ups." Day trading is the premier class of trading. With this in mind, one should also ask oneself a fundamental question before delving deeper into this area. That question is:
Can an amateur team compete in the Champions League?
I would like to thank my web designer Evangeline, who once again took on all the work involved in completing this book. PDF files of my books are available for purchase on my website for study purposes.
Perhaps after reading this book, you will see the crypto market in a different light.
November 2025

Available in other languages (Click learn more)
Many books describe forms of financial securities analysis. It was therefore more surprising to me that my book on profile zone analysis and order flow for day traders, published in 2021, attracted great interest. Apparently, there were gaps in knowledge in this area.
I also received questions about whether order flow and profile zones can be used to analyse shares. I took up this topic with curiosity, as I had already made my first attempts to analyse shares with TPO profiles in 2019. Unfortunately, however, I couldn't find any suitable software that provided enough data to process the order flow of a large number of shares and graphically integrate my preferred filters into the analysis. Attempts to use a data provider for Nasdaq shares failed due to technical problems with the integration into my order flow software at the time. As a result, I had to interrupt my work on this project repeatedly.
Although I initially wanted to abandon this project, I then found a software program that had been developed in India (Gocharting). I had been watching this software for some time, but at that point it only processed order flow data for the Indian stock market. In March 2024, I learned that the developers of this software had made the leap to the West, acquired CME data feed licenses from the US futures exchanges. They also offered order flow data from US stocks. This allowed me to continue my work.
When the book was finished, a new obstacle arose. The data feed provider for stocks was no longer available. I then set out to find a replacement, as I did not want to offer my book without available order flow material. Dx-Datafeed has been providing the data feed for Nasdaq stocks for most retail trading platforms for $29 per month for quite some time. A list can be found in chapter 7.4.3.
This book contains more than 230 current charts that are intended to illustrate that stock price movements are not random phenomena, but in many cases are based on factors that can be determined objectively. To avoid repetition and not unnecessarily prolong the book, the basic principles of my basic book are only briefly presented here.
However, taking specific characteristics into account, auction theory and order flow analyses can be applied to any market. This is demonstrated using two current trading examples from the interesting Indian market (section 10.3)
Analyses of this kind can only be carried out with order flow software and require some basic knowledge of chart analysis. The good news is that, unlike in the past, highly professional order flow software is now affordable for every interested investor and trader. A less favourable aspect is that you must invest some time in the learning process to be able to use the methods presented here effectively.
A major advantage of these approaches is that they reduce the need to analyse external information that feeds an entire industry and armies of analysts. As early as the 1950s, it was proven in the US that most stock market letters do not lead to better performance.
Successful investing requires the best possible timing. Another problem faced by many investors is finding the right time to sell or hedge a share that has made good gains, depending on the particular objective. This book also presents strategies that any investor can use without having to resort to complex and costly models.
When analysing financial assets in general, a fundamental question arises: Are markets efficient? Do they really contain all available fundamental data at all times? If this were the case, there should be no excesses. And what is the fair price of a share? Conventional valuation formulae often prove to be vague or inaccurate, and it would also be too easy to simply calculate future movements. Recent attempts to value shares using AI models have also failed to produce significant results.
George Soros was one of the first analysts to question the theories of classical valuation models, albeit in a different way. In his book "The Alchemy of Finance", published back in 1989, he argues that markets are rarely in perfect equilibrium, but are always dominated by a "prevailing bias", which he calls "reflexivity". According to Soros, this leads to movements that have begun continuing reflexively (I see an upward movement—I continue to expect an upward movement). However, as soon as it becomes apparent that this expectation is wrong, a trend can reverse just as quickly and lead to excessive movements in the opposite direction (Appendix).
This can be observed live almost daily in intraday high-speed mode. If you look at the behaviour of the markets, you often get the impression that institutional market participants also make rapid changes of opinion in some situations, which appear to be bipolar mood swings.
The founder of the TPO market profile, Peter Steidlmayr (see appendix), commented on the question of efficiency that markets may not be "efficient" but "effective" as they test price zones that are above or below a mean value for acceptance or rejection in a continuous auction process. This probably comes closest to reality. Pricing processes of this kind are much faster today than in Steidlmayr's time. This is perhaps what makes profile zones one of the most important methods of analysis, as they attempt to objectively assess the three fundamental elements of the market: Price, time and volume.
Markets in the 21st century do not follow the calculations of an Italian mathematician from the 13th century (Fibonacci). Nor do they move in line with the patterns of 18th century Japanese rice traders (candlesticks). And last but not least, they do not move predictably along geometric shapes or mathematically calculated indicators of a pseudo-science called technical analysis, which has never been empirically proven. When Warren Buffett was once presented with a chart and asked what he could see from it, he is said to have replied:
"I don't know how to turn it around!"
On a fundamental level, there were also some puzzles that became apparent before this book was published. At that time, the stock market had already been in a situation for several months that some advocates of classic ratios described as “heavily overvalued” but showed no signs of a correction.
This book provides an introduction on how to navigate through the constant ups and downs of the markets with less stress, without following a 24-hour circus of assessments. However, even this book cannot guarantee success. Anyone expecting a mechanical trading system here will be disappointed, because nothing is more important than the context in which the approaches shown here should be applied. This context is presented in the form of additional filters that simplify the fundamental environment for significant movements in graphic form. This way, the seemingly irrational and complex components of the market can be reduced to the essentials.
As I originally come from the commodities sector, separate chapters have been dedicated to the oil and gold sectors, as the dynamics of these commodities also have a strong impact on the shares of the respective sectors. Another highlight of the book is the chapter on analysing the price of gold and gold mines. It presents fundamental filters that have emerged from decades of observation and have withstood the test of time. If you use them correctly, you can come to some remarkable conclusions.
Success on the financial markets also depends on things that many people do not take for granted. Most people today are taught to make decisions as part of a team. However, when it comes to analysing stocks, you should base your decisions less on expert forecasts. This book is intended to provide a framework for developing a solid foundation for a better understanding of the market. Finally, you should keep the shortcomings that exist in everyone under control. If you don't know your weaknesses, sooner or later the market will uncover them - and that can be costly.
Since this book is also published in other languages, I have conveniently written all illustrations in the charts in English. The time zone indicated on the timelines is CET, in some cases local time. In order to use this book specifically as a manual, emphasis was placed on a detailed table of contents. For those who prefer a digital learning process, the book is also available for purchase as a PDF file on my website. Charts were created with Gocharting software, in exceptional cases with Tradingview and Atas.
I would like to thank my web designer Evangeline for the technical realisation of this manuscript.
December 2025

Learning processes for complex topics such as VMO analysis can generally be handled more effectively via PDF file.
Advantages:
• Mobile availability on desktop, smartphone and tablet.
• Lower price
The standard works "Next Generation of Daytrading" and "Short Term Trading" are still available in book form on Amazon, but are also offered as a PDF file on this website.
My other trading books are only available as PDF files and will be sent as a download after payment.
This is not intended for printing, but for individual use on electronic devices.
Other languages available:
Verified Amazon Reviews